Julia wanted a custom budget tracker. She downloads credit card statements each month - just data with dates, descriptions, and amounts. She needed it categorized, totaled by category, and visualized with charts. But she didn't want to spend hours typing categories into cells, writing SUMIF formulas, or building charts manually.
Before Pipedreamer, Julia was stuck with standard budget tracker apps. They had fixed categories she couldn't customize, rigid inputs that didn't match how she wanted to organize her spending, and no painless way to upload credit card statements. To build her own custom tracker in Excel, she'd have to manually type categories, write formulas, and create charts. This would have been hours of work. So she kept using apps that weren't quite what she wanted.
With Pipedreamer, Julia built her entire budget tracker without editing a single cell. This includes four different tabs, split across two credit cards and two different summary views. She just described what she wanted and uploaded some PDFs (or even just screenshots!) to populate the tables:
Example Prompts
"Column A has dates. Column B has transaction descriptions. Categorize each transaction into: Groceries, Food/Drink, Fitness, Shopping, Transport, Subscriptions, or Events. Put the category in column C. D has amount, E is whether the charges were applied"
Second Prompt
"Create a table showing each category and the total amount spent. Then create a pie chart showing spending by category."
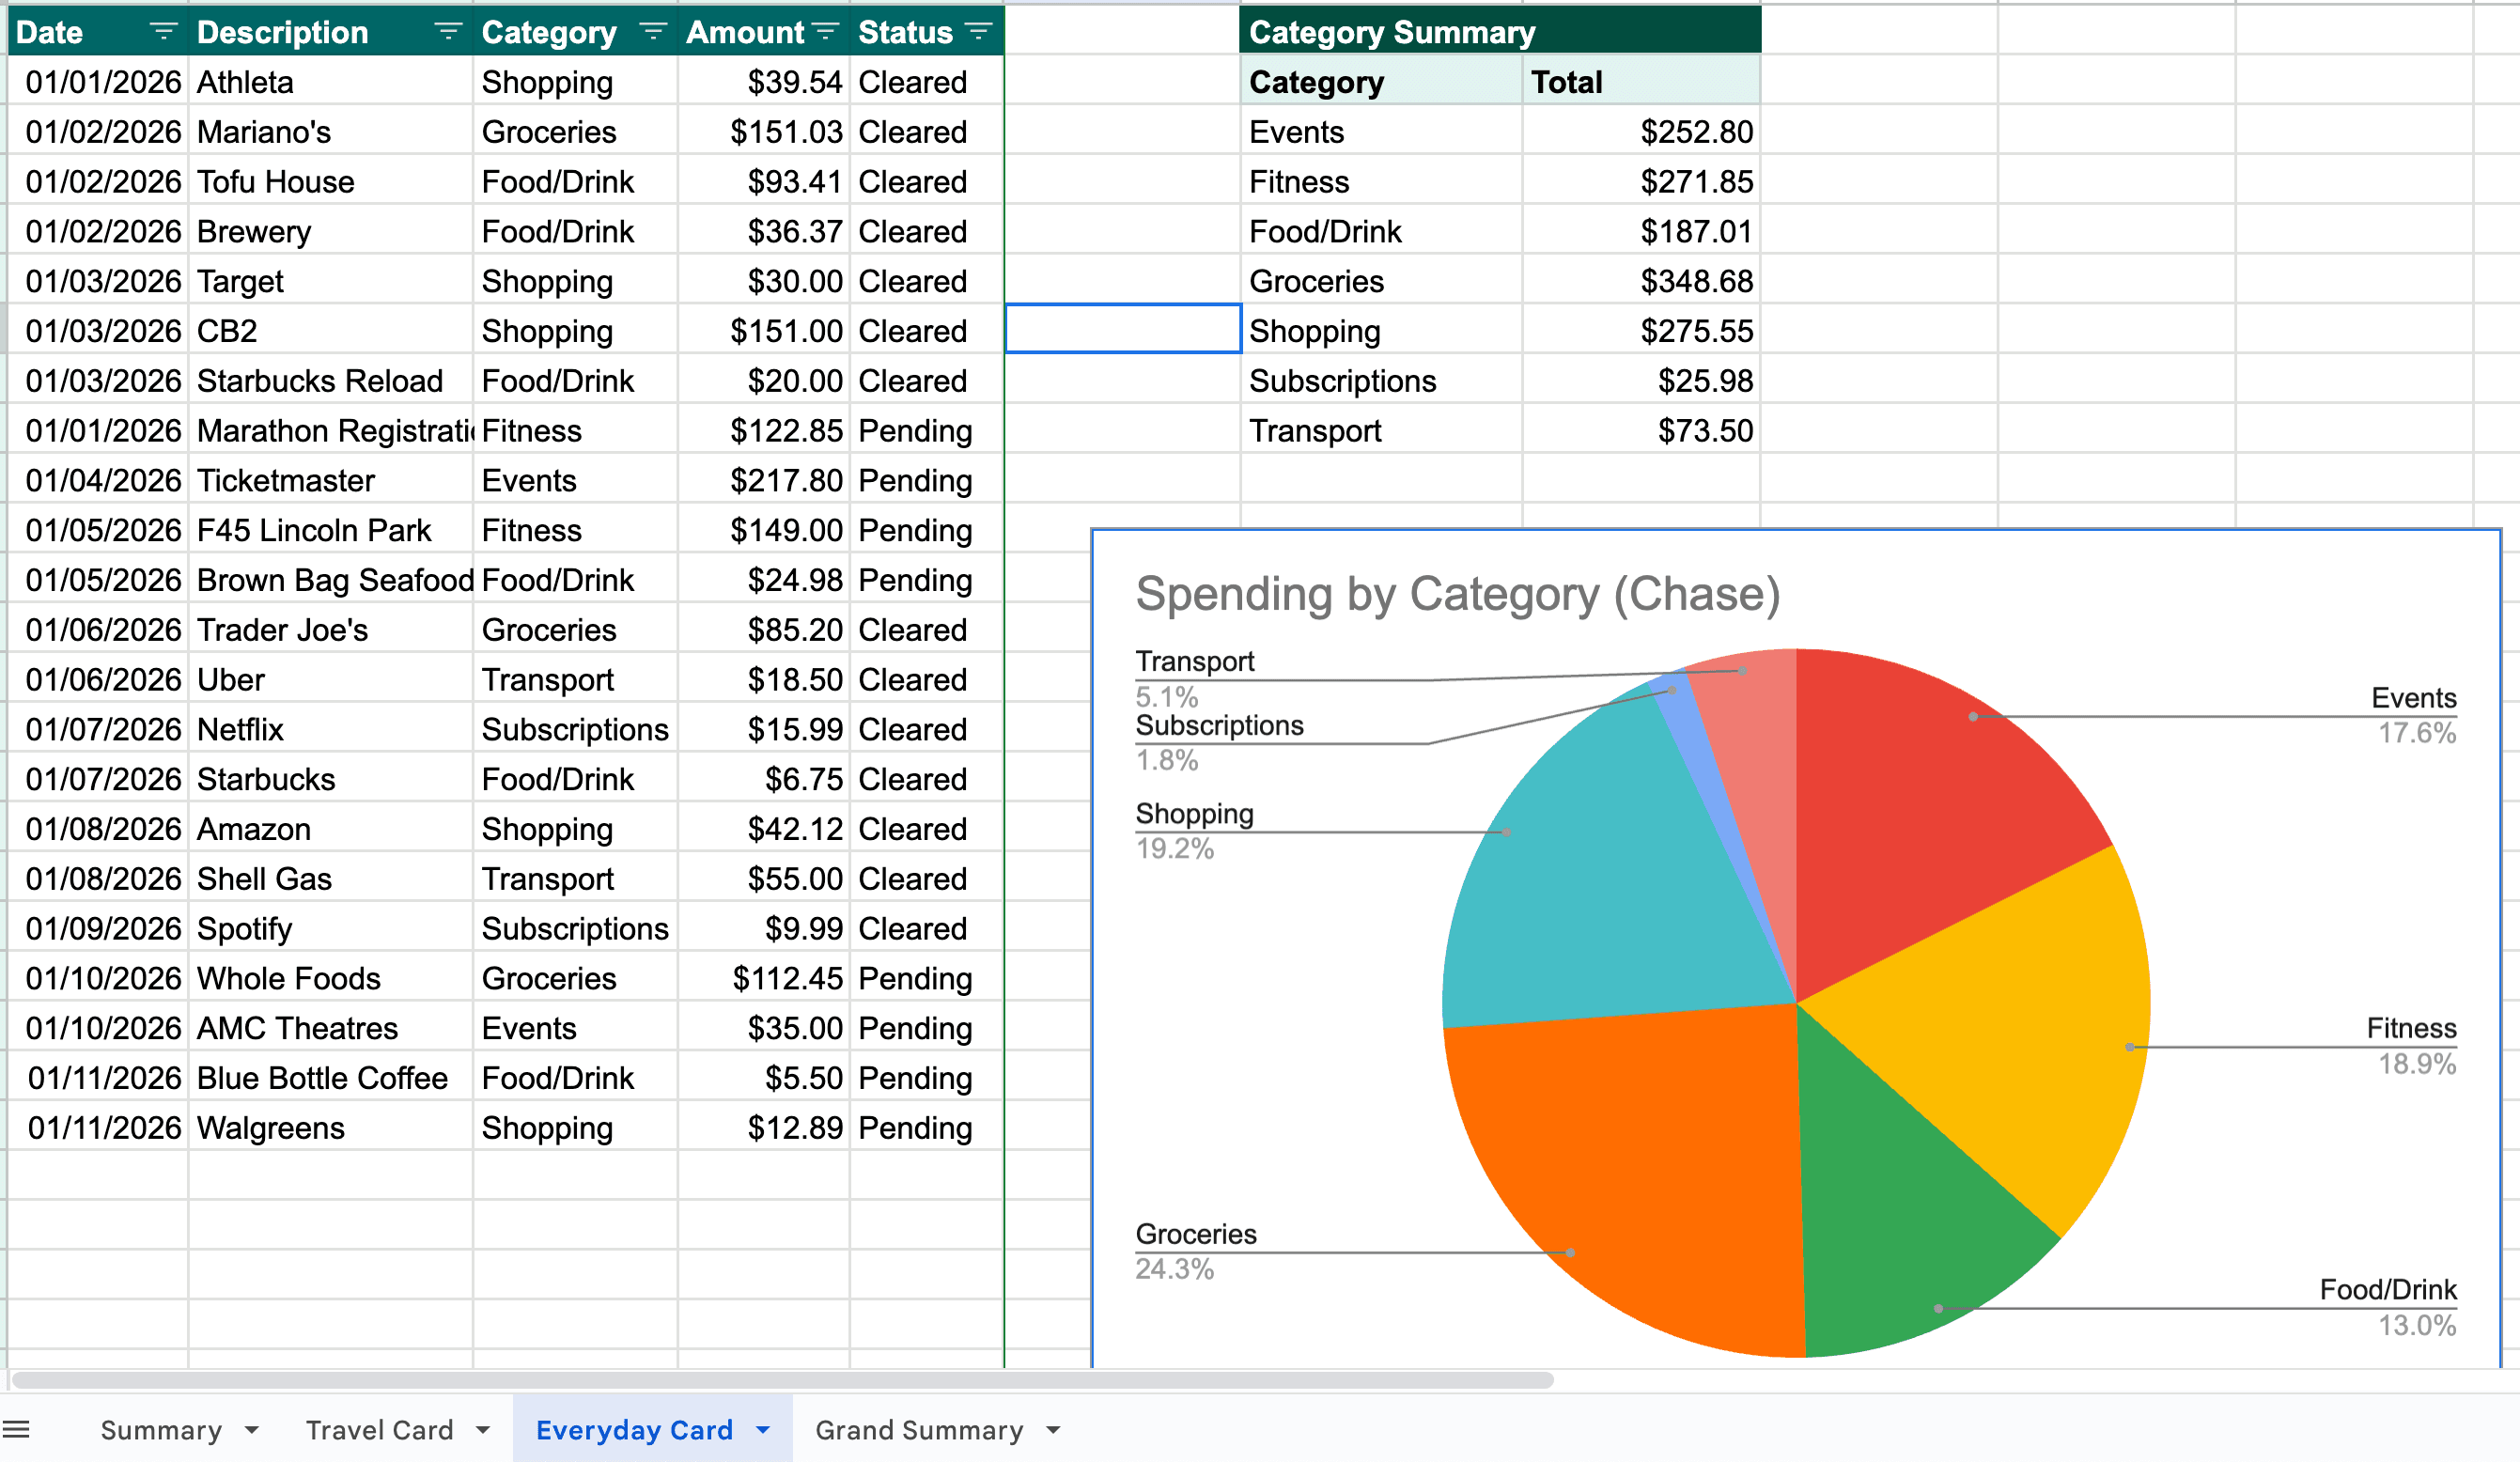
That's it. No clicking cells. No typing formulas. No chart wizard. Pipedreamer read Julia's raw transaction data, understood her categorization rules, wrote all the formulas, created the summary table, and generated the pie chart automatically. If something looked wrong, she could revert and adjust her description. But most of the time, it worked perfectly on the first try.